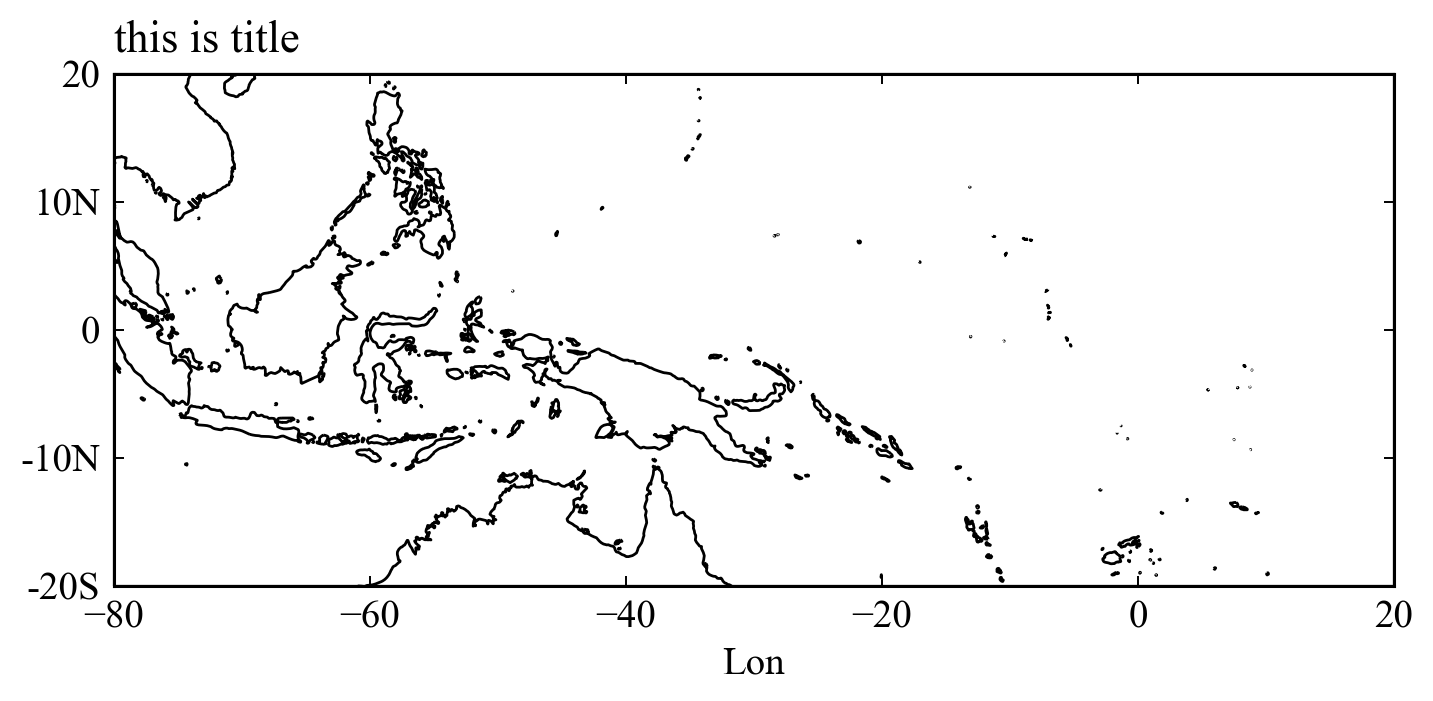
# -*- coding: utf-8 -*-
"""
@author: Jianpu

@email: Xianpu_JI2024@outlook.com

introduction : keep learning althongh walk slowly
"""

import cartopy.feature as cfeature
import numpy as np
import xarray as xr
from cartopy.mpl.ticker import LongitudeFormatter,LatitudeFormatter
import cmaps
import matplotlib.pyplot as plt
import cartopy.crs as ccrs
import matplotlib.ticker as mticker
from cartopy.mpl.gridliner import LONGITUDE_FORMATTER, LATITUDE_FORMATTER


##############################################################################

################ plot #######################################################
lon = np.arange(100,200,10)
lat = np.arange(-20,21,1)

##############################################################################

box = [100,200,-20,20]
xstep,ystep = 20,10
proj = ccrs.PlateCarree(central_longitude=180)
plt.rcParams['font.family'] = 'Times New Roman',

##############################################################################


fig = plt.figure(figsize=(8,7),dpi=200)
fig.tight_layout()
ax = fig.add_axes([0.1,0.2,0.8,0.7],projection = proj)
ax.set_extent(box,crs=ccrs.PlateCarree())
ax.coastlines('50m')
ax.set_xticks(np.arange(box[0],box[1]+xstep, xstep),crs=ccrs.PlateCarree())
ax.set_yticks(np.arange(box[2], box[3]+1, ystep))
lon_formatter = LongitudeFormatter(zero_direction_label=False)#True/False
lat_formatter = LatitudeFormatter()
# ax.xaxis.set_major_formatter(lon_formatter)
ax.yaxis.set_major_formatter(lat_formatter)
ax.spines[['right','left','top','bottom']].set_linewidth(1.1)
ax.spines[['right','left','top','bottom']].set_visible(True)
ax.set_xlabel('Lon',fontsize=14)
ax.set_yticklabels(['-20S','-10N','0','10N','20'])
ax.set_title('Significance Test',fontsize=16,pad=8,loc='right')
ax.set_title('this is title',fontsize=16,pad=8,loc='left')
ax.tick_params(    which='both',direction='in',
               width=0.7,
                    pad=5,
                    labelsize=14,
                    bottom=True, left=True, right=True, top=True)

plt.show()

