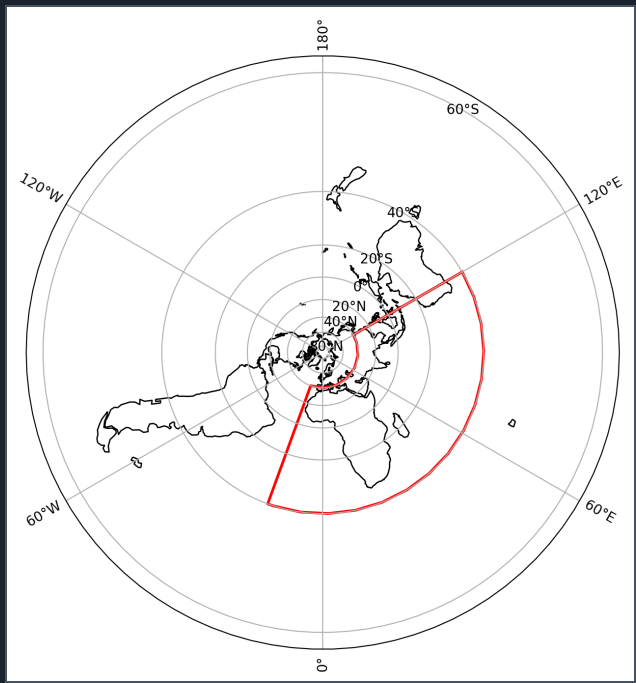
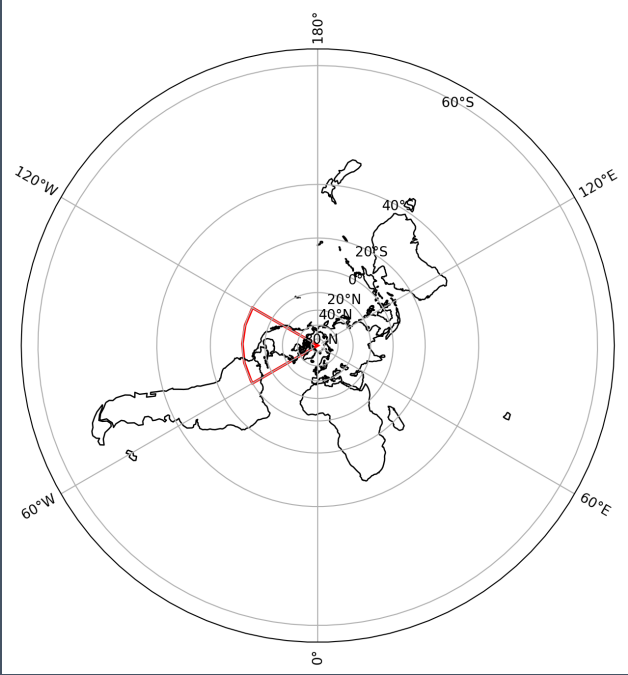
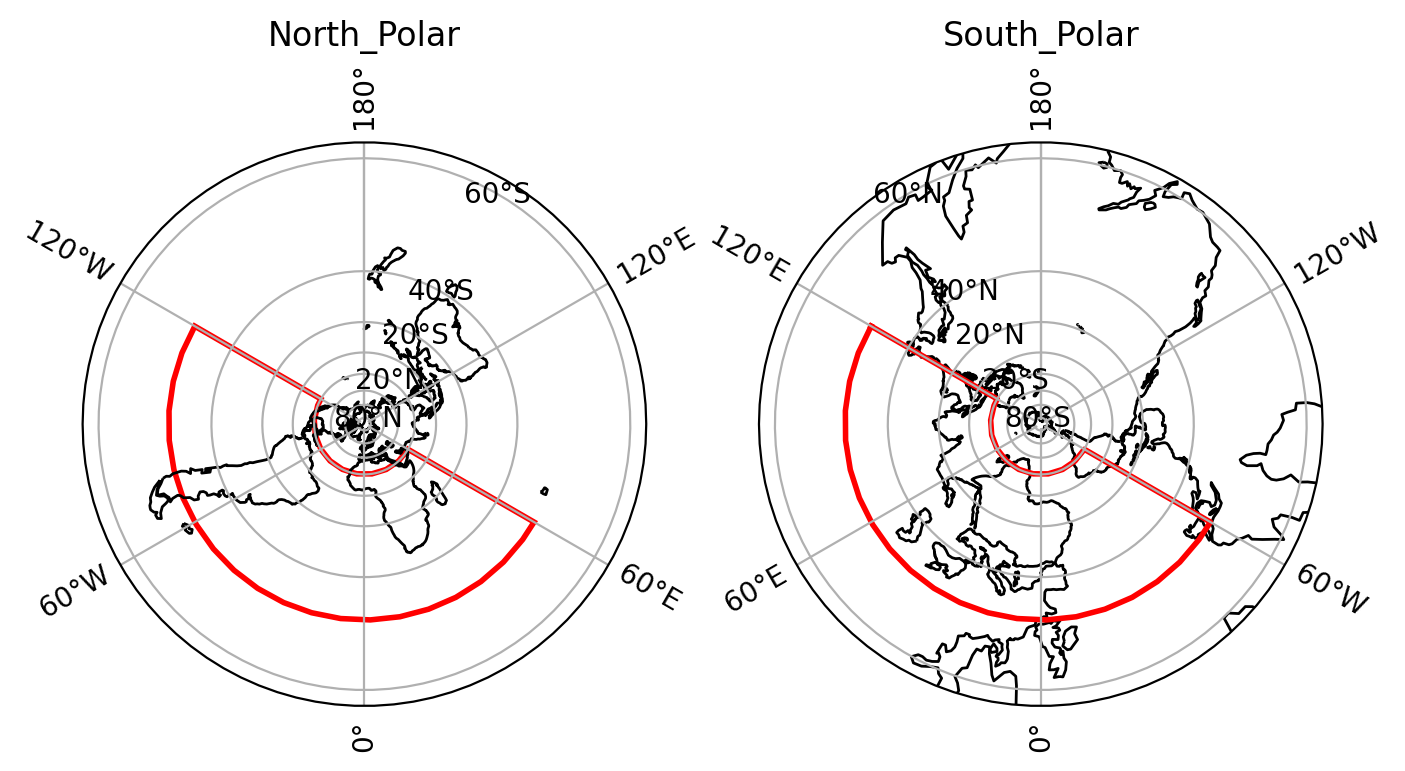
- How to add a fan-shaped border to a polar projection map in python

or

code as following:
# -*- coding: utf-8 -*-
"""

@author: Jianpu

@email: Xianpu_JI2024@outlook.com

introduction : keep learning althongh walk slowly
"""

import numpy as np
import cartopy.crs as ccrs
import matplotlib.pyplot as plt
import matplotlib.patches as mpatches

fig = plt.figure(figsize=(8, 8),dpi=200)

ax1  = plt.subplot(1,2,1,projection=ccrs.NorthPolarStereo(0))
ax2  = plt.subplot(1,2,2,projection=ccrs.SouthPolarStereo(180))


# 绘制整个地图的边界
ax1.set_global()


lon1, lon2, lat1, lat2 = -120, 60, -50, 20

# 绘制红色线条框选出的区域
rect = mpatches.Rectangle((lon1, lat1), lon2 - lon1, lat2 - lat1,
                            linewidth=2, edgecolor='red', facecolor='none',
                            transform=ccrs.PlateCarree())
ax1.add_patch(rect)

# 添加网格线和海岸线
ax1.gridlines(draw_labels=True)
ax1.coastlines()
ax1.set_title('North_Polar')


lon1, lon2, lat1, lat2 = 120, -60, 50, -20

# 绘制红色线条框选出的区域
ax2.plot([lon1, lon2, lon2, lon1, lon1], [lat1, lat1, lat2, lat2, lat1],
        color='red', linewidth=2, transform=ccrs.PlateCarree())
ax2.set_global()
ax2.gridlines(draw_labels=True)
ax2.coastlines()
ax2.set_title('South_Polar')

# 显示图形
plt.show()

