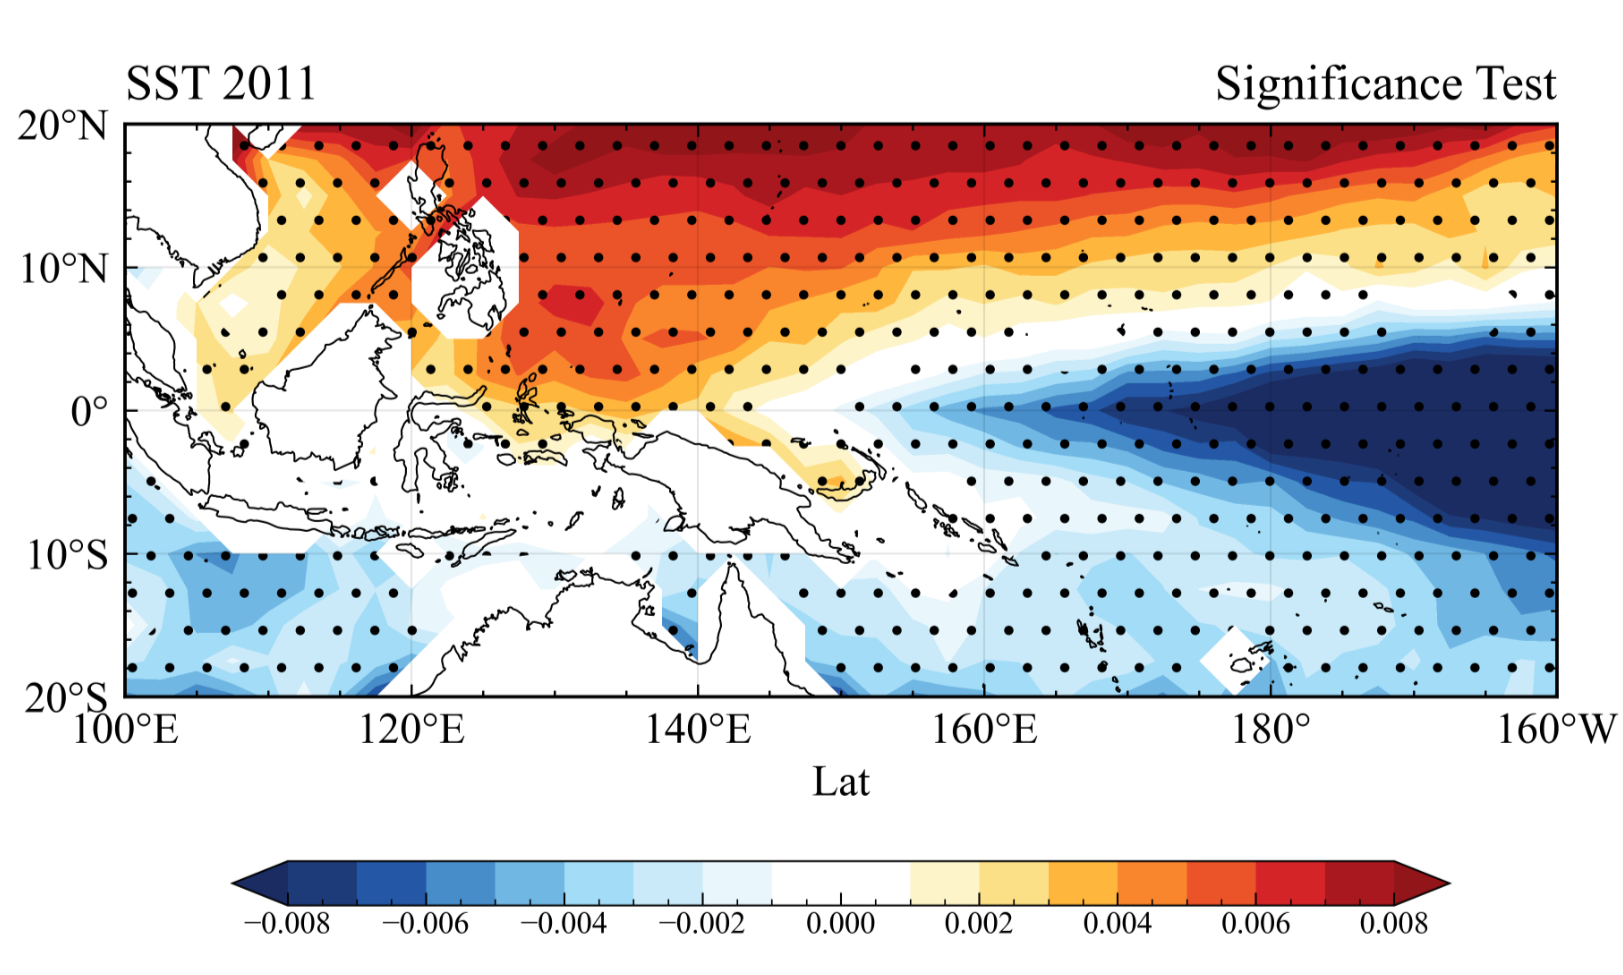
dataset - 数据集:
- SST (Daily Sea Surface Temperature) NOAA High-resolution Blended Analysis
-
daily
-
分辨率:2.5°x2.5°
-
时间:2010
-
links: https://psl.noaa.gov/data/gridded/data.noaa.oisst.v2.html
- OLR (Outgoing Longwave Radiation)- NOAA Interpolated OLR
- daily
- 分辨率:2.5°x2.5°
- 时间覆盖范围:1974-2013
- links: https://psl.noaa.gov/data/gridded/data.olrcdr.interp.html
# -*- coding: utf-8 -*-
"""
@author: Jianpu

@email: Xianpu_JI2024@outlook.com

introduction : keep learning althongh walk slowly
"""
import cartopy.feature as cfeature
import numpy as np
import pandas as pd
import xarray as xr
import glob
from matplotlib.colors import ListedColormap
from cartopy.mpl.ticker import LongitudeFormatter,LatitudeFormatter
import matplotlib as mpl
from metpy.units import units
import metpy.constants as constants
import metpy.calc as mpcalc
import cmaps
import matplotlib.pyplot as plt
import cartopy.crs as ccrs
import matplotlib.ticker as mticker
from cartopy.mpl.gridliner import LONGITUDE_FORMATTER, LATITUDE_FORMATTER

olr_path = r'J://olr.day.mean.nc'
sst_path = r'J://sst.intep.nc'

da1 = xr.open_dataset(sst_path).sortby('lat')
da2 = xr.open_dataset(olr_path).sortby('lat')

sst = da1.sst.sel(lat=slice(-30,30),lon=slice(100,200))
olr = da2.olr.sel(lat=slice(-30,30),lon=slice(100,200),
                  time=slice('2010','2010'))

trend = np.zeros((sst.lat.shape[0],sst.lon.shape[0]))
p_value = np.zeros((sst.lat.shape[0],sst.lon.shape[0]))

for i in range (0,sst.lat.shape[0]):
    for j in range (0,sst.lon.shape[0]):
        trend[i,j], intercept, r_value, p_value[i,j], std_err=stats.linregress(olr[:,i,j],sst[:,i,j])


###############################################################################

################ plot #######################################################
lon = sst.lon.data
lat = sst.lat.data


box = [100,200,-20,20]
xstep,ystep = 20,10
proj = ccrs.PlateCarree(central_longitude=180)
plt.rcParams['font.family'] = 'Times New Roman',


fig = plt.figure(figsize=(8,7),dpi=200)
fig.tight_layout()
ax = fig.add_axes([0.1,0.2,0.8,0.7],projection = proj)
ax.set_extent(box,crs=ccrs.PlateCarree())
ax.coastlines('50m')
ax.set_xticks(np.arange(box[0],box[1]+xstep, xstep),crs=ccrs.PlateCarree())
ax.set_yticks(np.arange(box[2], box[3]+1, ystep),crs=ccrs.PlateCarree())
lon_formatter = LongitudeFormatter(zero_direction_label=False)#True/False
lat_formatter = LatitudeFormatter()
ax.xaxis.set_major_formatter(lon_formatter)
ax.yaxis.set_major_formatter(lat_formatter)
ax.spines[['right','left','top','bottom']].set_linewidth(1.1)
ax.spines[['right','left','top','bottom']].set_visible(True)
ax.set_xlabel('Lon',fontsize=14)
ax.set_xlabel('Lat',fontsize=14)
ax.set_title('Significance Test',fontsize=16,pad=8,loc='right')
ax.set_title('SST & OLR 2010',fontsize=16,pad=8,loc='left')
ax.tick_params(    which='both',direction='in',
               width=0.7,
                    pad=5,
                    labelsize=14,
                    bottom=True, left=True, right=True, top=True)

c = ax.contourf(lon,lat,trend,
                levels=np.linspace(-0.012,0.012,17),
        extend = 'both', transform=ccrs.PlateCarree(), cmap=cmaps.BlueWhiteOrangeRed)

c1b = ax.contourf(lon,lat, p_value,[np.nanmin(p_value),0.05,np.nanmax(p_value)],
                      hatches=['.', None],
                      colors="none", transform=ccrs.PlateCarree())
cb=plt.colorbar(c,
                shrink=0.85,
                pad=0.15,
                orientation='horizontal',
                aspect=25,

                )
cb.ax.tick_params(labelsize=10,which='both',direction='in',)

plt.show()

